今天看到生产的es集群有报错:
{"type": "server", "timestamp": "2021-11-15T14:19:15,189Z", "level": "ERROR", "component": "o.e.x.i.IndexLifecycleRunner", "cluster.name": "elasticsearch", "node.name": "elasticsearch-master-2", "message": "policy [sai-log] for index [sai-detail-2021-11-02] failed on step [{\"phase\":\"hot\",\"action\":\"rollover\",\"name\":\"check-rollover-ready\"}]. Moving to ERROR step", "cluster.uuid": "dscxSgouRw--mhyuj5Y2fw", "node.id": "9yklgtqpTNuQU25hIOWkxQ" ,
"stacktrace": ["java.lang.IllegalArgumentException: setting [index.lifecycle.rollover_alias] for index [sai-detail-2021-11-02] is empty or not defined",
"at org.elasticsearch.xpack.core.ilm.WaitForRolloverReadyStep.evaluateCondition(WaitForRolloverReadyStep.java:65) [x-pack-core-7.10.1.jar:7.10.1]",
"at org.elasticsearch.xpack.ilm.IndexLifecycleRunner.runPeriodicStep(IndexLifecycleRunner.java:174) [x-pack-ilm-7.10.1.jar:7.10.1]",
"at org.elasticsearch.xpack.ilm.IndexLifecycleService.triggerPolicies(IndexLifecycleService.java:327) [x-pack-ilm-7.10.1.jar:7.10.1]",
"at org.elasticsearch.xpack.ilm.IndexLifecycleService.triggered(IndexLifecycleService.java:265) [x-pack-ilm-7.10.1.jar:7.10.1]",
"at org.elasticsearch.xpack.core.scheduler.SchedulerEngine.notifyListeners(SchedulerEngine.java:183) [x-pack-core-7.10.1.jar:7.10.1]",
"at org.elasticsearch.xpack.core.scheduler.SchedulerEngine$ActiveSchedule.run(SchedulerEngine.java:216) [x-pack-core-7.10.1.jar:7.10.1]",
"at java.util.concurrent.Executors$RunnableAdapter.call(Executors.java:515) [?:?]",
"at java.util.concurrent.FutureTask.run(FutureTask.java:264) [?:?]",
"at java.util.concurrent.ScheduledThreadPoolExecutor$ScheduledFutureTask.run(ScheduledThreadPoolExecutor.java:304) [?:?]",
"at java.util.concurrent.ThreadPoolExecutor.runWorker(ThreadPoolExecutor.java:1130) [?:?]",
"at java.util.concurrent.ThreadPoolExecutor$Worker.run(ThreadPoolExecutor.java:630) [?:?]",
"at java.lang.Thread.run(Thread.java:832) [?:?]"] }
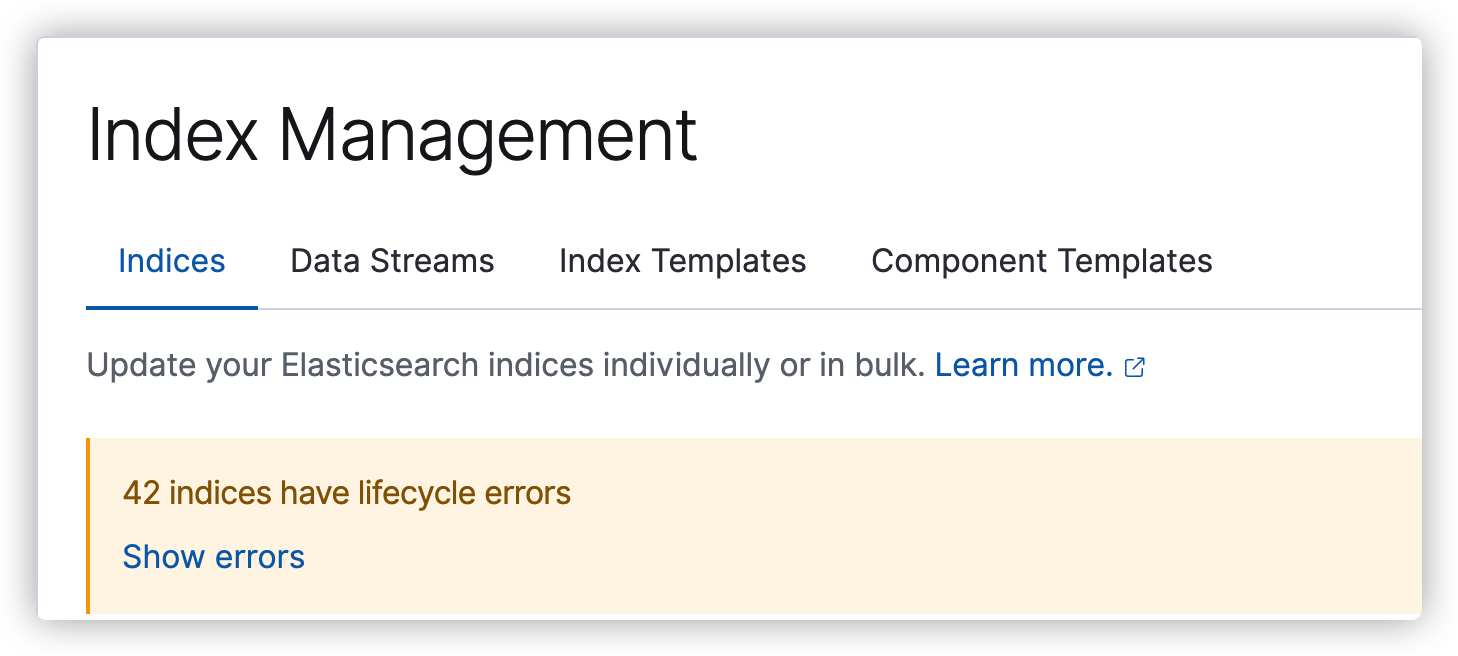
跟同事一起查看了下,发现kibana的Index Management界面,有错误提示:
后面同事修改了ILM,错误消失。
下班回家,去查了日志,发现错误仍在,看来美誉解决问题,
GET /sai-log-2021-11-13/_ilm/explain output: { "indices" : { "sai-log-2021-11-13" : { "index" : "sai-log-2021-11-13" , "managed" : false } } }
POST /sai-log-2021-11-13/_ilm/retry

output:
{
  "error" : {
    "root_cause" : [
      {
        "type" : "illegal_argument_exception",
        "reason" : "cannot retry an action for an index [sai-log-2021-11-13] that has not encountered an error when running a Lifecycle Policy"
      }
    ],
    "type" : "illegal_argument_exception",
    "reason" : "cannot retry an action for an index [sai-log-2021-11-13] that has not encountered an error when running a Lifecycle Policy"
  },
  "status" : 400
}
前往kibana的ILM界面,绑定ILM策略到index template
GET /sai-log-2021-11-13/_ilm/explain output: { "indices" : { "sai-log-2021-11-13" : { "index" : "sai-log-2021-11-13" , "managed" : true , "policy" : "sai-log" , "lifecycle_date_millis" : 1636732801982, "age" : "2.94d" , "phase" : "hot" , "phase_time_millis" : 1636986555834, "action" : "rollover" , "action_time_millis" : 1636733356166, "step" : "check-rollover-ready" , "step_time_millis" : 1636986555834, "is_auto_retryable_error" : true , "failed_step_retry_count" : 211, "phase_execution" : { "policy" : "sai-log" , "phase_definition" : { "min_age" : "0ms" , "actions" : { "rollover" : { "max_size" : "30gb" , "max_age" : "60d" } } }, "version" : 3, "modified_date_in_millis" : 1636960453087 } } } }
解决了?
前往kibana的Index Management界面,依旧存在 42 indices have lifecycle errors。
手动来一下:
POST /sai-log-2021-11-13/_ilm/retry

output:
{
  "acknowledged" : true
}
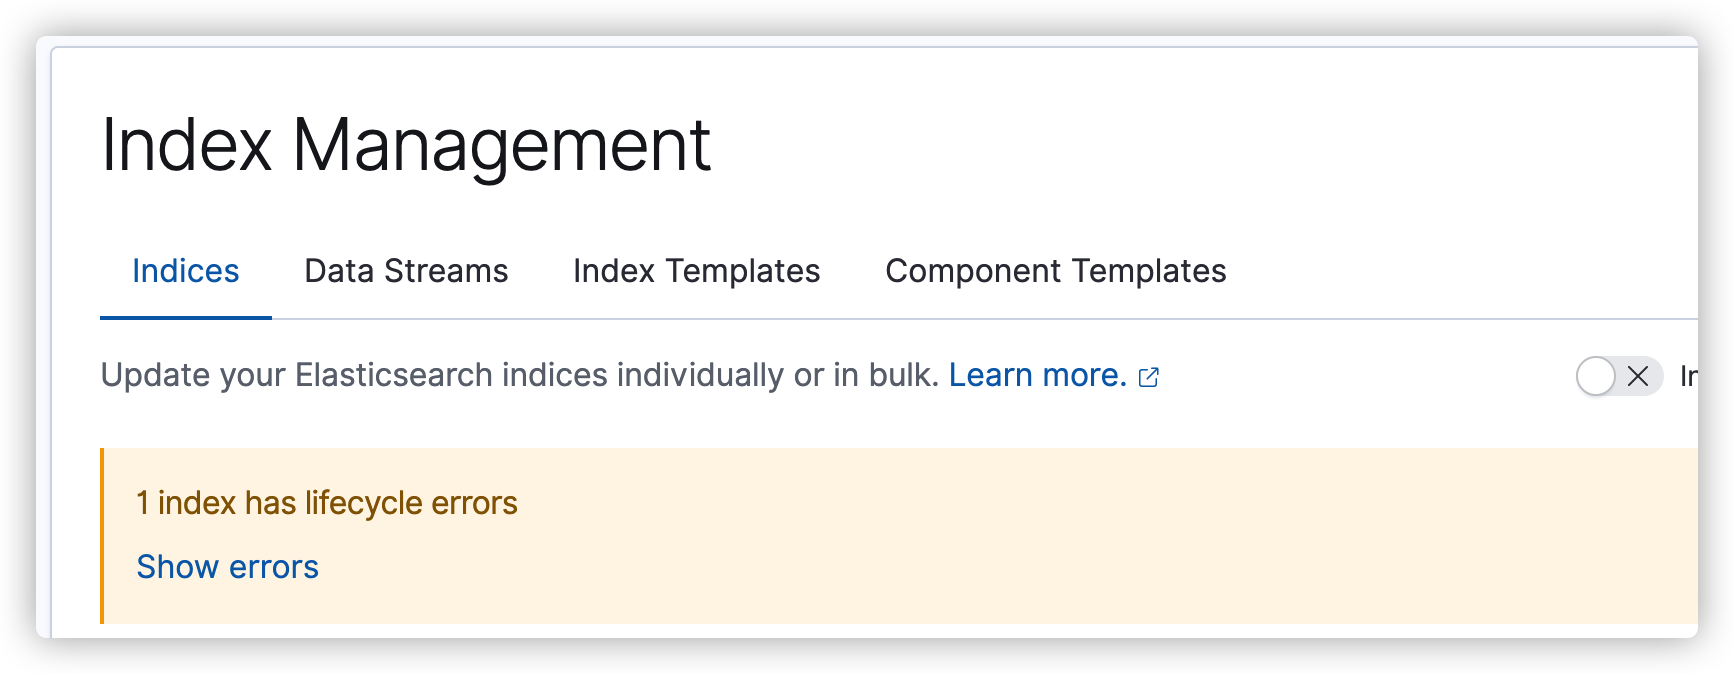
重复explain,发现输出一致,再去kibana的Index Management界面瞅瞅:
还有一个,retry命令处理下即可。
基本算是解决了。
参考: